This document describes the x11vis X11 visualizer. It should contain all information you need to setup and use x11vis on your system(s). Should you have any questions and/or improvements to this document, please contact me via IRC, XMPP or email.
1. Motivation
In the X11 development world, the most useful tool that is widely used is xtrace. It implements a proxy to which the X11 clients you want to trace connect and dumps the requests, replies and events which are sent in plain text.
While xtrace is very useful for debugging simple problems, there is a lot of room for improvement in the visualization of this output. Here are my ideas, ordered by importance:
-
Using plain text as output format is problematic. While plain text is displayed just fine in a variety of programs and can be processed with traditional UNIX tools such as grep, it is not very well arranged.
Instead, x11vis dumps the gathered information into a JSON file which is afterwards loaded by a graphical user interface. Displaying the gathered information can either be done live, post-mortem or periodically, whichever model works best for debugging a particular problem. -
xtrace replaces X11 atom IDs with their corresponding names. While this is a good idea, x11vis aims to go much further: For every ID it keeps track of what the ID represents (a window, font, pixmap, …) and assigns a human-readable name to it (which you can change interactively or with a set of rules). For example, the window with ID 0x1800023 will be named Chromium (using its WM_CLASS and/or _NET_WM_TITLE).
Also, this information will be available for all requests, replies and events that use the particular ID, no matter when the _NET_WM_TITLE or WM_CLASS is actually set (the information "travels in time").
Similar to assigning names to IDs, errors can be referenced from the requests they correspond to. -
Due to xtrace dumping information as plain text, it needs to be as verbose as possible. This is bad for a lot of requests, for example QueryTree which will return a lot of window IDs in a typical X11 session. While you do want to see the QueryTree request, you don’t necessarily want to look at it in detail. x11vis therefore only displays a one-line summary of each request, reply or event and provides detailed information when the user requests it. Also, the summary strives to be as useful as possible while not consuming much space. For example, instead of x=0 y=0 width=1280 height=800, x11vis will display (0, 0) 1280x800.
-
Filtering and searching is not handled by xtrace at all (obviously). x11vis however provides various filter mechanisms to either complete hide specific requests or groups of requests (the rendering includes CopyArea, …) or to group these events. For example, you would get one line telling you that the program requested 10 X11 atoms instead of 10 lines.
Furthermore, x11vis provides an IPC interface with which an application (in debugging mode) or a user can set markers. These markers are shown clearly visible in the GUI and you can jump to specific markers. By setting markers before and after reproducing a specific bug you can significantly reduce the amount of time you need to navigate through the collected information. -
Multiple clients are distinguished in xtrace by a different number at the beginning of a line. x11vis only allows X11 TCP connections in order to lookup the remote endpoint of the connection and display the program name / commandline which initiated the connection. This greatly simplifies distinguishing the different clients in your X11 session.
Another interesting idea in this area is to place the various clients next to each other horizontally. While this only works well on big screens (you would need to filter on smaller screens), it should make the involvement of the different clients very clear.
2. Assumptions
x11vis is modern software and software used for debugging/analyzing. Therefore I make a few assumptions which are not standard in software development:
-
The implementation of the program that acts as a proxy between X11 and your client(s) is done in Perl instead of a low-level language such as C or C++. This allows for short development times, efficient programs (achieve much with little code) at the cost of a little performance and a higher start-up time (due to compilation by the Perl interpreter).
-
Memory consumption is per se not important. The machines I work with have 8 GB of memory, so I expect yours to have a few gigabytes, too. Of course, reducing memory consumption where it’s easily possible is a good thing, but it’s not very high priority. Usually, x11vis runtimes are short (a few minutes to hours at most), so trading little memory usage with very detailed and helpful debugging information is worth it.
3. Requirements
First of all: Please look if there are packages for the distribution you use. You should use them instead of installing everything manually.
If there are no packages, please install the software and create a package :-).
You need the following Perl modules (get them from CPAN):
-
AnyEvent
-
AnyEvent::Socket
-
Twiggy
-
Dancer
-
IO::All
-
JSON::XS
-
Moose
-
MooseX::Singleton
-
XML::Twig
For the GUI, you need a recent browser with fast JavaScript support (the JavaScript libraries are bundled). I recommend Chromium. Please note, however, that you don’t need a browser on the machine you are running the interceptor on. You can just as well debug over a (local) network.
4. Getting it running
Use the x11vis(1) tool to automatically start an interceptor and run your application through the interceptor:
$ x11vis xwininfo -root
If this does not work for you for whatever reason, you can start the interceptor by hand (it is installed to /usr/lib/x11vis/interceptor/interceptor.pl by default) and then run your program:
$ /usr/lib/x11vis/interceptor/interceptor.pl &
$ DISPLAY=127.0.0.1:0 xwininfo -root
Then, connect to http://localhost:5523/ in your browser.
5. Building blocks of x11vis
- Interceptor
-
The interceptor is the part of x11vis that sits between your client and the x11 server (a proxy, so to say). It forwards packets in both directions and dumps the dissected packets as JSON file.
At the same time, the interceptor manages your traces and provides the webinterface. It needs to run while you use the GUI. - Burst
-
A burst consists of multiple packets in either direction (from client to x11 or from x11 to the client). When the interceptor recognizes activity on a socket, it will read until no more reading is possible.
- GUI
-
x11vis’ graphical user interface (GUI) is implemented as a web application. You can either access it on the local system or on a remote system.
In the GUI, you can display, filter and analyze the packets the interceptor collected so far. There are different packet types:-
Requests (from the client to X11)
-
Replies (from X11 to the client)
-
Events (from X11 to the client)
-
Cleverness: additional information collected by the interceptor, like titles for window IDs, atom IDs, etc.
-
- Icing
-
The short description of every packet is called icing (on the cake of the full request data).
6. Using the x11vis Graphical User Interface
6.1. Introduction
After pointing your browser to http://localhost:5523/, you will see the x11vis welcome page, redirecting you to a particular session. In the future, you will be able to store sessions along with annotations and the preferences you have made. It should look like this:
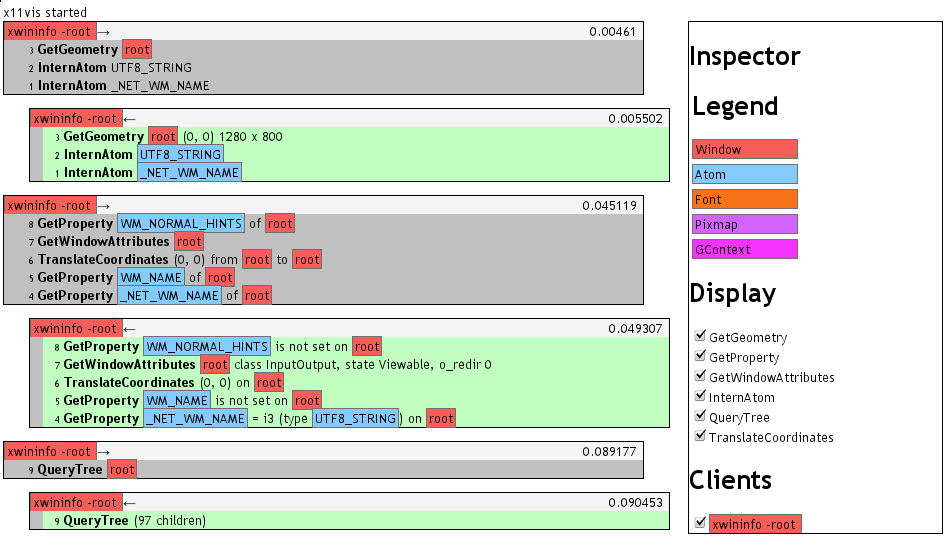
The x11vis GUI consists of two parts: On the right side, you have the information panel, showing you information about selected elements and allowing you to filter certain packets, clients, etc. The rest of the page is filled with the collected data itself. This data can be bursts (multiple packets, such as requests, replies, events or errors) or markers.
A burst looks like this:
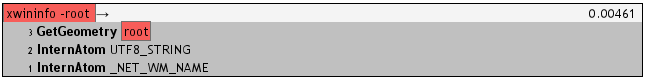
You can see some meta information on the top of each burst:
-
On the left side, you can see which program is involved in this burst (the little arrow behind the program name indicates the direction).
-
On the right side, the timestamps specifies the elapsed time (in seconds) since the program connected.
The packets included in each burst have different colors, indicating what type of packet they are: requests are grey, replies are green (while errors are red) and events are yellow.
By default, every packet has a short description which contains the most useful information (in general) about this packet. Let’s consider the GetGeometry reply: The most interesting information is the geometry itself (x, y, width, height) and for which window this reply was. More detailed information like the color depth or border width are available after expanding the packet by clicking on it (you can see a little expand icon on the left when you move your mouse over the packet).
6.2. Folding
By default, x11vis folds sequences (more than 5) of "boring" packets. By clicking on the packet, you can expand them to their full length. Packet types considered boring are currently:
InternAtom, GrabKey, ImageText8, ImageText16
6.3. Using markers
When handling a large amount of data, navigation can be quite hard. While you can hide some packet types or whole clients completely, you might want to look at every detail to make sure everything is alright.
To quickly navigate to the important part of the output, x11vis supports markers. You can either manually set markers by using the x11vis(1) utility or you can tell your programs to set markers at interesting points.
In the GUI, markers are displayed as a line with red background, so you can easily spot them:

Also, you can see the marker bar at the bottom of the screen which displays the next and previous marker. By clicking on the display markers, you will jump to them.